Where to? Reflections on Europe, Spring 2019.
The European Union (EU) is holding EU parliamentary elections every 5 years in all member states and 2019 is election year. The elections are held in late May. This Spring I spent nearly two months in Budapest, Hungary, where I was born, the city I left as a migrant refugee more than sixty years ago. Hungary is an EU member state. In Budapest there was a feverish electioneering pitch, much of it driven by spokesmen for the ruling FIDESZ party of the populist prime-minister Orban. This pitch dominated the press, TV, and posted public space advertisements.
In summary: the Hungarian government and ruling party are pro-Trump and are Eurosceptics. They proudly proclaim illiberal democracy and rail against progressive liberals. They view everything that the Obama administration did in Washington, and all the EU administration thus far has done in Brussels, as failures, damaging a Christian European tradition that the good try to protect (mostly against migrants and all ills that progressive ideas may lead to).
One daily paper is Magyar Nemzet, which during my stay in Budapest I digested daily to gain a better understanding of local trends and feelings.Two articles caught my attention. One appeared on May 10, p.12, and the other on May 11, p.10. The first one addressed global food production concerns, it contained detailed data on the agricultural productivity of all EU member states. The second one expressed an opinion that the progressively ascending Eastern-Europe (referred to in the locally preferred style as Central-Europe) will defend the weakening West even “against itself”.
Having read these thought-provoking articles, I got interested in collecting some economics facts that would allow me a comparative assessment of the EU countries for a better understanding of the well-being in the EU of East vs. West, and also ot the EU vs. the rest of the World. Some of my quantitative findings are in Tables 1, 2, and 3.
The first table presents some details on the agriculture, budgets, and human development levels of the individual EU states. Here the budget refers to the EU “common” budget, into which all EU states contribute and from which they receive funding for specific purposes. This common EU budget is about 1 % of the EU GDP and about 2 % of its aggregate public spending. The measure for human development I use here is the Human Development Index (HDI) published by the UN. It is a metric that combines life expectancy, education, and income.
Table 2 provides basic GDP and ecological performance comparisons of the major global contenders, plus Hungary’s own standing by the same measures. The ecological indicator I employ here is the percentage surplus or (deficit) of the space that is needed to support each country’s activity (food, industry, etc.); it is obtained from the ratio of the space needed (known as the ecological footprint) divided by the sustainably available space (biocapacity). When this ratio equals 1 (0 % ecological footprint overshoot), life is marginally sustainable; when it is <1, life is sustainable (positive % overshoot); when it is >1 (negative % overshoot), more natural resources are consumed than are available renewably from the biosphere and life in the current style in the long run is not sustainable. For example in Table 1, the USA is shown with -131 % overshoot, meaning that to accommodate sustainably the current human activities of the USA would require an area 131 % larger than what is available for such activities from the biosphere located in the USA.
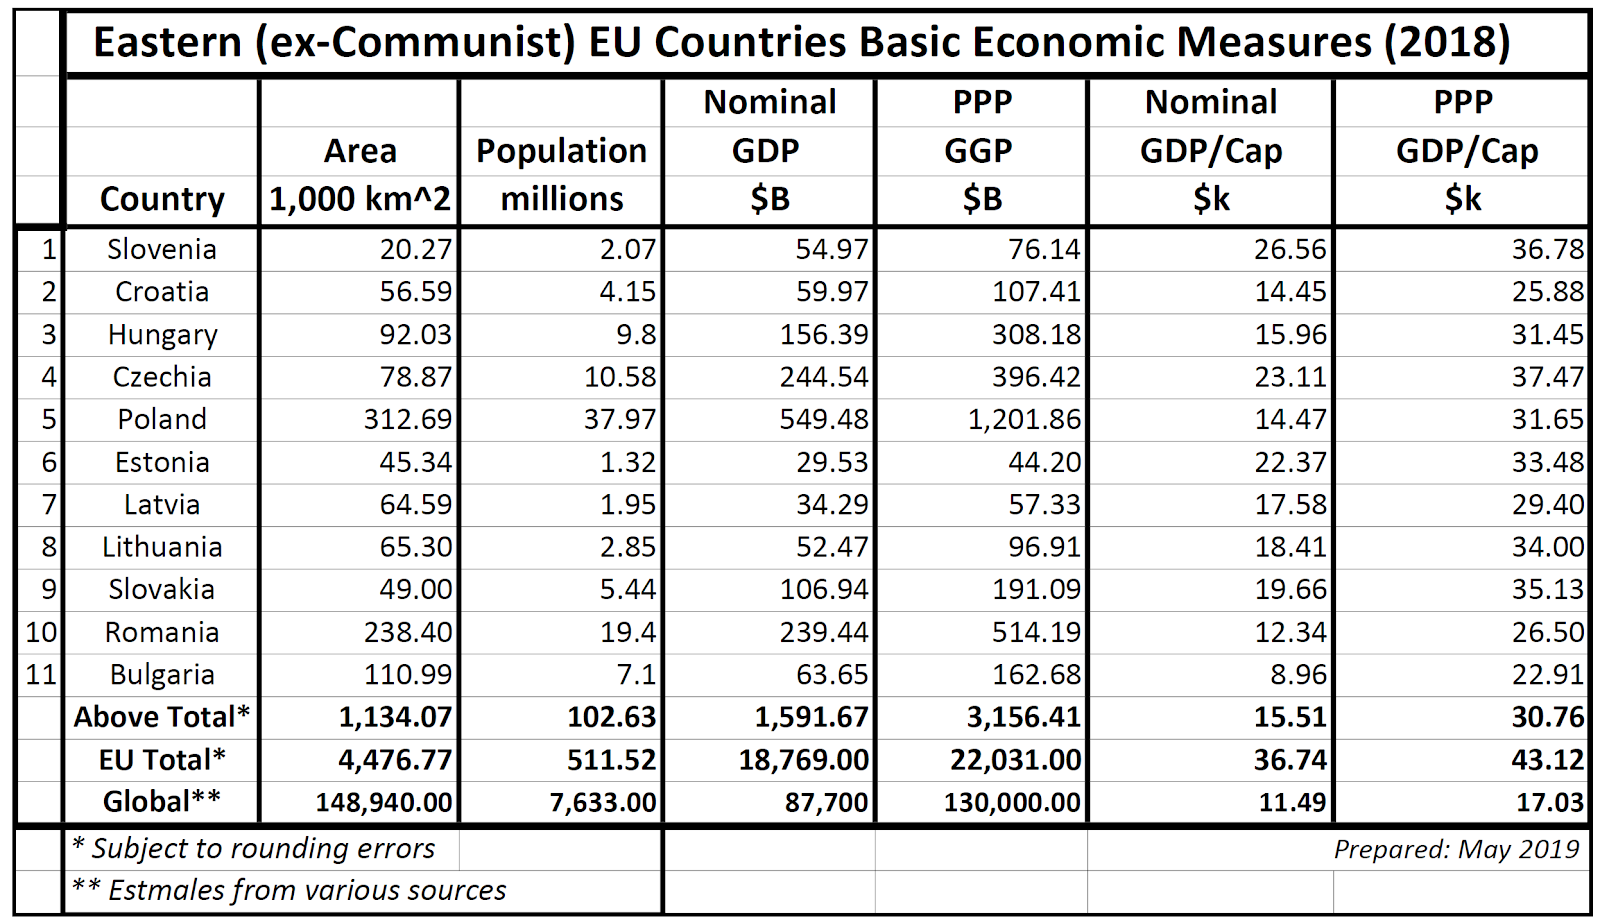
Table 3 focuses on the economic performance (GDP) of the 11 Eastern European member states of the EU that were formerly communist states, either as part of the Soviet Union or as satellites thereof. This table also provides GDP data for the EU as well as the Global total.
From the data in Table 1 we conclude that the supposedly “weakened” West does provide direct financial support to the “ascending” Eastern Europe. Specifically, from the available 2017 budget data, the Eastern European states paid 8.7 Be (Billion euros) into the EU budget and received 31.2 Be from it. Specifically Hungary paid in about 0.8 Be and received over 4 Be, thus it net benefitted over 3 Be from the ”weakened” West’s largess. Furthermore, it is interesting to note that in 2017 the Hungarian GDP was 125 Be and its Government budget was about 60 Be. Thus the Western EU states subsidized Hungary to the tune of about 3 % of its GDP and 5 % of its Government activities.
Table 1 also suggests significant agricultural shortfalls in Eastern vs. Western Europe. Using the data from the above referenced May 10 Hungarian newspaper article, the table shows for each of the 28 EU countries their total agri-cultivated area (measured in kH, where 1 kH = 1,000 Hectares) and its percentage contribution to the total EU agricultural production. From this it is easy to calculate an EU agricultural productivity index, kH/1%, that measures the average area in each country that would be required to produce 1 % of the EU’s total. From this we see that in Eastern Europe about 3,000 kH (3 million Hectares) is needed to produce 1 % of the EU’s total, while in Western Europe less than half of that is sufficient.
Furthermore, It is interesting to note from Table 1 that while 15 Western states (out of the 17) have higher HDI than 10 (out of the 11) Eastern ones (Slovenia is ahead of Italy and Greece), from a global perspective all 28 EU states are closely clustered. Even though Russia’s exceeds the HDI of the least developed EU states (Romania and Bulgaria), out of 189 countries listed in the 2018 UN report, more than 150 have HDIs below that of the lowest in the EU.
Analysis of the data presented in Table 3 shows that the 11 Eastern European (ex-Communist) states have 20 % of the population, produce 8 % of the nominal and 14 % of the PPP GDP of the EU. Furthermore, these 11 countries on the average show 42 % nominal and 71 % PPP GDP/Cap of the average overall EU levels. But globally they are above average: their PPP based GDP/Cap is close to twice that of the Global average. Thus, they are poor by EU standards, but well off with respect to the rest of the World.
The problem of Global Warming is well documented and is recognized to be caused by human activities. While climate deniers ( most notably President Trump of the USA and some of his followers) do exist, the scientific consensus is that this is anthropogenic and is a major threat to humanity and to life on Earth in general. The analysis based on ecological footprint calculations shows that since the late 1960s mankind has used more of the Earth’s biocapacity than is available. Man’s use now exceeds Earth’s biocapacity by 64 %. The growing dominant factor is the insufficient biocapacity to sustainably recycle Carbon. Carbon now represents over 60% of the total human ecological footprint and is the principal driver of Global Warming. As Table 2 indicates, all major economies (except Russia with its mostly empty Siberia) have significant negative overshoots. The current situation is bad and it is likely to get worse. There are several reasons for this: 1) the ongoing shortfall causes a progressive reduction of available biocapacity; 2) as developing countries progress, they tend to use more natural resources; 3) by 2100 the global population is expected to grow by 3.5 Billion people, a 45 % increase.
There is no greater technical priority for humankind than ending our dependence for energy on Carbon. No efforts should be spared from making the transition from Carbon to sustainable energy resources, which today are solar PV and wind, backed up by nuclear. These are well established technologies; switching to them requires commitment and investment. Major research and development efforts should be initiated in energy storage technologies. With sufficient commitment the impending anthropogenic environmental disaster can be mitigated, and possibly even prevented.
Much has been discussed about migration.Some predicted that the 2019 European Parliamentary elections are a referendum on how to deal with migration. Some want to build walls, others want to offer welcoming subsidies. Both of these may provide solutions for locally specific problems of today, but are not likely to provide solutions to Europe’s long term migration problem. A fence at Hungary’s Southern border forced migrants who did not want to stay, to pass by and not through. An open arms German policy welcoming Turks and others helped to solve a labor shortage problem. But what has happened thus far is nothing in comparison to what can be expected in the remainder of this century and in the next one. Immigration (and thus emigration) are driven by politics, demographics, economics, and environmental changes. They are accelerated/retarded by geographic relationships. All of these observable forces and factors indicate that Europe is likely to face an onslaught that had not been seen in millennia. By year 2100 Africa’s population is predicted to increase by more than 3 billion people (to 4.5 billion) whose life’s sustainability is highly uncertain; while affluent Europe’s population is forecast to decrease by about 100 million (to 650 million). None of the currently discussed, and mostly mutually opposing ideas, are likely to resolve this major demographic issue to everyone’s satisfaction. (As a wise optimist recently told me: “we humans have always invented our way out from problems that faced us, we will do so again, this time we may lose a billion people here, another billion there…”.)
Today we may argue, but the generations following us will have to face the problems: environmental sustainability and migration. In fact, they are not separable problems.
Who is weakening: mankind?
Appendix: Some closing thoughts and surprising realities
Much of the publicly displayed venom in the pre-election political advertisements of the Hungarian ruling party was directed at the “unelected” EU functionaries in Brussels. In fact, these functionaries are led by the European Commission. The Commission has 28 members and one member comes from each of the 28 member states of the EU. They are individually proposed by the Council of the European Union (popularly elected representatives of the member states) and as a group are approved by the European Parliament (also elected directly by the citizens of the member states). The Commission and the associated cabinets function much like the executive branch of a government responsible for the common affairs of the EU.
A recent ECFR survey revealed some surprising public attitudes.
Hungarians (and also Romanians and Poles) see their European identity overwhelmingly more important than their own nationality (Scandinavians have a more balanced view of their identity).
Hungarians (and also Romanians and Poles) are more worried about emigration than about immigration (Scandinavians are the other way around).
In Hungary, 43% of the people feel that their country is broken and only 22% feels that both the EU and their own country works (in Romania and Poland the numbers are different, but the trend is the same; in Scandinavia the trend is the opposite, there more people feel that both work than those who feel that their country is broken).
The European parliamentary elections are over and contrary some prediction, it was not a referendum on migration; migration was not the overwhelming deciding issue. The results show an increasing polarization and shallowing of the center. In Hungary the governing FIDESZ party got majority, but its position (and that of its leader, Prime-minister Victor Orban) weakened in the EU.
TABLE1

TABLE 2
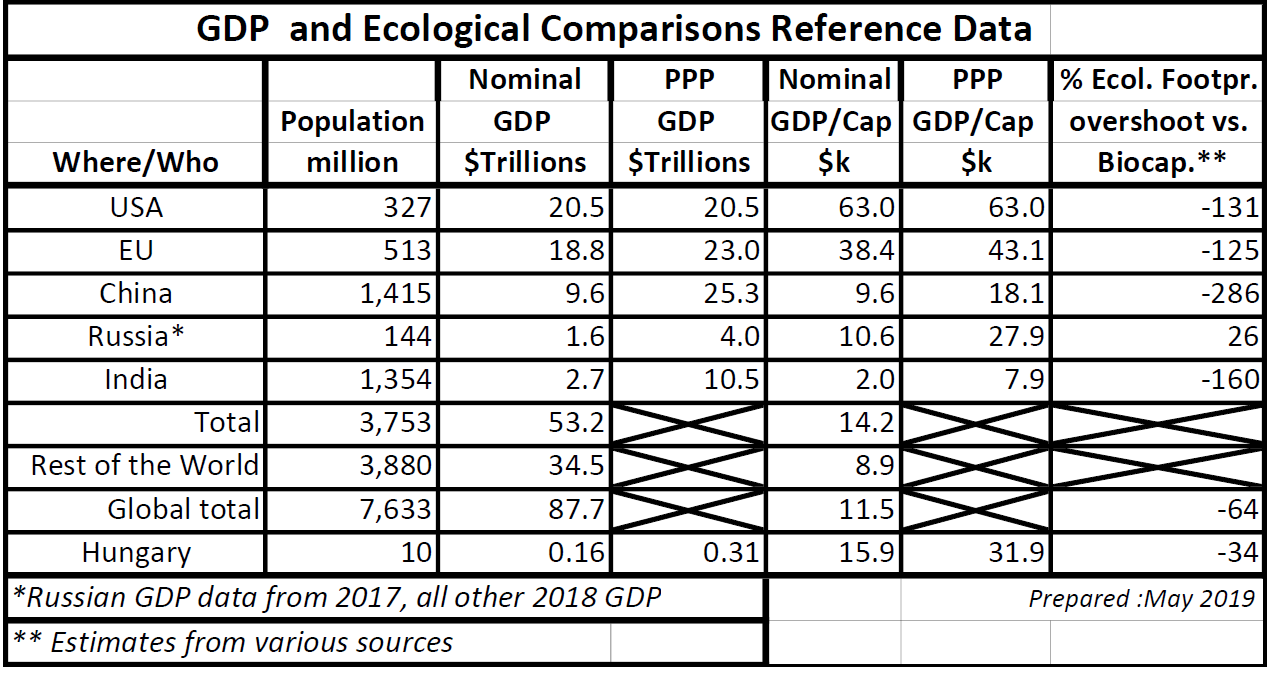
TABLE 3
Sources:
http://www.europarl.europa.eu/external/html/budgetataglance/default_en.html#denmark The EU budget at a glance (payments to and from the EU) - - From Wikipedia on May 14, 2019: The European Union has a budget to finance for policies carried out at European level (such as agriculture, regional development, space, trans-European networks, research and innovation, health, education and culture, migration, border protection and humanitarian aid).
https://www.footprintnetwork.org/resources/glossary/#biocapacity Glossary of terms related to biocapacity
https://en.wikipedia.org/wiki/List_of_countries_by_ecological_footprint List of countries by ecological footprint
http://data.footprintnetwork.org/#/ Ecological Footprint Explorer (footprint and biocapacity by country, per person, plus related data and explanation)
https://www.mdpi.com/2079-9276/7/3/58/htm Article Ecological Footprint Accounting for Countries: Updates and Results of the National Footprint Accounts, 2012–201
https://ourworldindata.org/world-population-growth World Population Growth, by Max Roser, Hannah Ritchie and Esteban Ortiz-Ospina, First published in 2013; most recent substantial revision in May 2019.
https://www.footprintnetwork.org/content/images/article_uploads/EcologicalFootprintCalifornia_Method_2013.pdf Methodology and California details
https://www.footprintnetwork.org/content/images/uploads/National_Footprint_Accounts_2011_Document.pdf National footprint accounts 2011 report
statisticstimes.com/economy/european-countries-by-gdp.php European GDPs 2018 https://www.ecfr.eu/specials/what_europeans_really_want_five_myths_debunked European Council on Foreign Relations (ECFR), report dated April 2019, “What Europeans Really Want….”