I live by the Pacific Ocean and every morning I shuffle (used to run when I was younger) along the shore of Humboldt Bay. One recent morning I noticed an exceptionally low tide and I realized that I did not know how tides work. I then looked on the web and became rapidly confused by what appeared to be contradictory explanations published by what I thought were reliable sources. Then I found Donald Simanek’s paper: “Tidal Misconceptions” (Ref. 1) and things became clearer; indeed, there are conflicting views resulting from misconceptions. Simanek’s paper guided me to Eugene Butikov: “A dynamical picture of the oceanic tides” (Ref. 2). Much what follows here below is based on Butikov’s paper, augmented by my own analysis.
The physics of tides is well understood, but the details of the timings and magnitudes of tidal events at specific locations along shorelines depend on the local geography and currents; local predictions are beyond the capability of theoretical analysis and are based on accumulated data. In the following discussion, I focus on the interaction between the Moon and the Earth. Similar considerations apply to the interactions between the Sun and the Earth. However, even though the mass of the Sun is much larger than that of the Moon, the distance from the Sun to the Earth is much larger than that from the Moon to the Earth and therefore, the lunar gravitational force gradient at the Earth is much larger than the solar one. It is this gradient that is the source of the tidal forces. Thus, in the following, I focus on the Moon-earth interaction. (See Figure 1.)
The Moon and the Earth form a binary system rotating about their CM (Center of Mass of the Earth-Moon system) located along a line connecting the centers of the Moon’s and the Earth’s masses, it is about 4,700 km towards the Moon from the center of the Earth. Since the radius of the Earth is about 6,300 km, the Moon-Earth CM is inside the Earth.
The simplest tide model examines the inertial and gravitational forces that may influence periodic changes of sea levels. (To be specific regarding my use of the term “inertial force”, I follow Butikov, Ref. 2, and here inertial force is the “pseudo-force” such that on any mass point placed at the center of the Earth it balances exactly the Moon’s gravitational force.)
The orientation of the Earth is fixed relative to distant stars. Thus, the Earth is experiencing a translational motion along its approximately circular orbit about CM. Simple geometric arguments show that at all times, all points on Earth rotate with the same radius whose length equals the distance between CM and the center of the Earth; and at any instant of time, the directions of all radii of rotation of all points on Earth point in the same direction, i.e., they are parallel. (See Figure 2.) Therefore, in the simplest model, the sub-lunar and antipodal locations on Earth experience the same inertial (centrifugal) force (away from the Moon) and in the formation of the bulges in sea level that correspond to high tides at these locations inertial forces can play no role.
The Moon and the Earth are coupled by gravity as described by Newton’s law of universal gravitation. The Moon’s gravitational force at any point on Earth is proportional to the inverse-square of the distance from the Moon’s center. Thus, along the line passing through the centers of the Earth and the Moon, the Moon’s gravity decreases continuously from the sub-lunar to the antipodal point. On the surface of the Earth, there is more pull towards the Moon at the sub-lunar point than at the center of the Earth and less pull towards the Moon at the antipodal point than at the center of the Earth. Thus, at both the sub-lunar and the antipodal points the lunar gravity force acts against the Earth’s gravity (reduces the weight of a mass point). Because the radius of the Earth is much smaller than the Moon-Earth distance, the net weight reductions at the sub-lunar and antipodal points are about the same and two tidal bulges of approximately equal magnitude form on opposite sides of the Earth.
In general, the net tidal force acting on any mass-point located anywhere in/on Earth is equal to vector- sum of the lunar-gravity force and the inertial (centrifugal) force due to the rotating Moon-Earth binary system. The inertial force is constant (same for all mass points), but the lunar gravity varies both in magnitude and direction; therefore, the net resultant force on the surface of the Earth is not constant and, depending on the location, it may have both radial (pointing along the line connecting the location and the Earth’s center) and tangential (pointing along the local horizon) components. Along the circumference (a great circle) of the Earth defined by the intersection of the surface of the Earth and a plane passing through the center of the Earth and that is normal to the line passing through the centers of the Moon and the Earth, the net tidal force is radial inward, causing a net weight increase. At all points on the Earth surface other than those either lying on this circumference, or at the sub-lunar and antipodal locations, the tidal force has both radial and horizontal components. The resultant static deformation of the Earth has the shape of an ellipsoid with its major axis along the line that passes through the centers of the Earth and the Moon. As the Earth spins about its own axis, observers located on the surface of the Earth will approximately twice daily sweep through tidal bulges and depressions (high and low tides). Approximately, because of the Moon’s rotation around the Earth slowly (relative to the Earth’s rotation about its spin axis) turns the tidal ellipsoid. The actual period is 12 hours and 25 minutes, that is, the two subsequent high (or two subsequent low) tides occur 12 hours and 25 minutes apart. The maximum lunar high tide to low tide difference calculated from the simple model is about 0.5 meter.
There is one significant problem with the above simple model: it predicts that the high-tide bulges occur at the sub-lunar and antipodal points and the low tides occur along the great circle defined by the intersection of the Earth’s surface and a plane that is normal to the line passing through the sub-lunar and antipodal points. In fact, observations of the tidal phenomena indicate that the above tide pattern does not occur and frequently high tides are observed where the simple model predicts low tides and vice versa. Butikov provides a reconciliation of observation and theory by including hydrodynamics in the model of tides. According to this reconciliation, tidal forces excite standing waves in the water of the seas and that these standing waves produce a modified tidal ellipsoid with its major axis rotated away from the line connecting the centers of the Moon and the Earth. The tidal amplitudes that result from this modified ellipsoid are influenced in addition to the Moon-Earth gravitational interaction by the resonant frequency of the standing waves and their damping constant. This hydrodynamics-augmented lunar gravitational force model provides a conceptual framework that agrees with the gross features of the observed tidal patterns.
In their detailed features, real tides at the shores are significantly different from those predicted by the simple theory augmented by hydrodynamic standing wave considerations. For example, the estimated magnitude of low to high tide difference was cited above as 0.5 meters. At the Bay of Fundy, off the coast of New Brunswick in Canada, 16-meter tides are observed (Ref. 3). Actual tides are influenced by many factors, including local geographic formations, water currents, as well as the Sun and the inclination of the Earth’s spin axis relative to the Moon and Sun orbital planes. There is no known general theory that can accurately predict the tides for any specific location. Accurate tidal predictions are important for shipping and for managing the daily affairs of shoreline communities. Detailed, reliable tide information is available for many locations based on historical observations. The data agree well with the theoretical predictions of periodicities, but the details of tide charts are based on the records obtained from long-term measurements.
Ref.1 https://www.lhup.edu/~dsimanek/scenario/tides.htm
Ref.2 Butikov, Eugene I. "A dynamical picture of the oceanic tides." Am. J. Phys. 7000 9, Sept. 2002. See the pdf on his website: http://butikov.faculty.ifmo.ru/Planets/Tides.pdf.

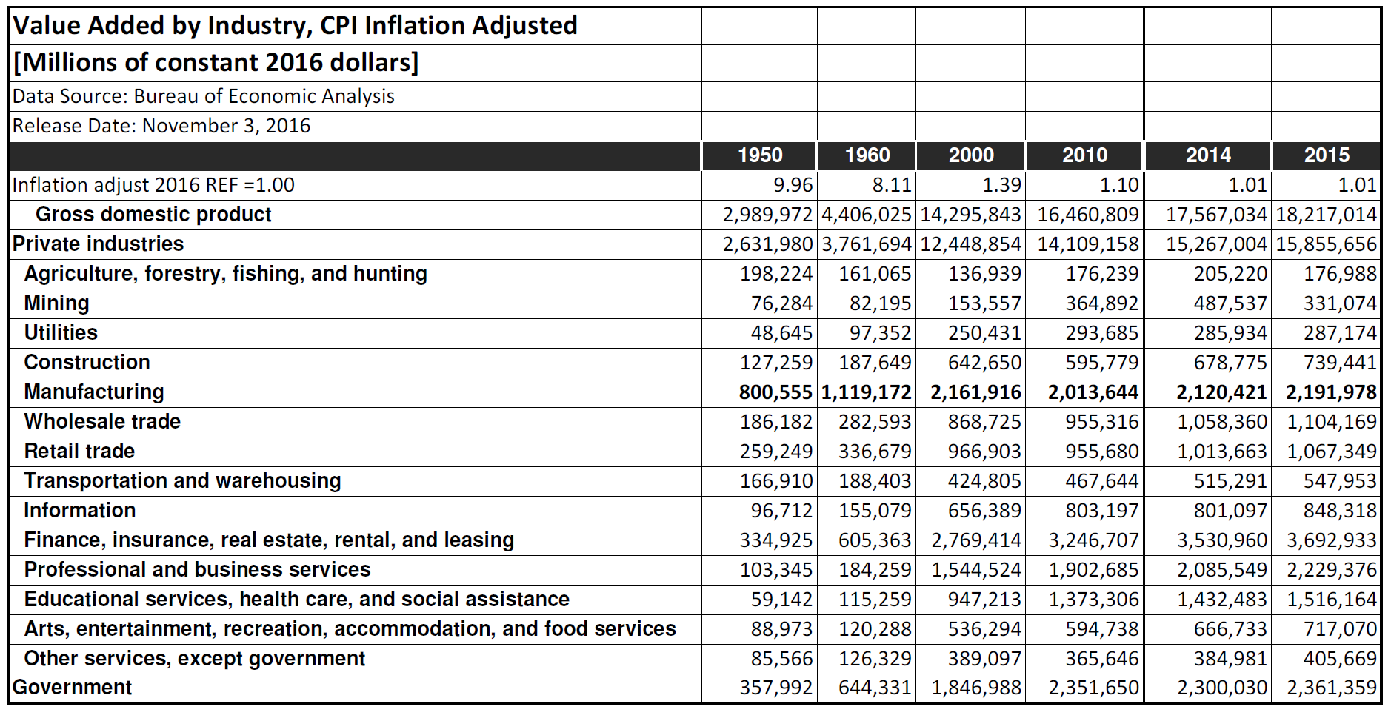
Figure 1
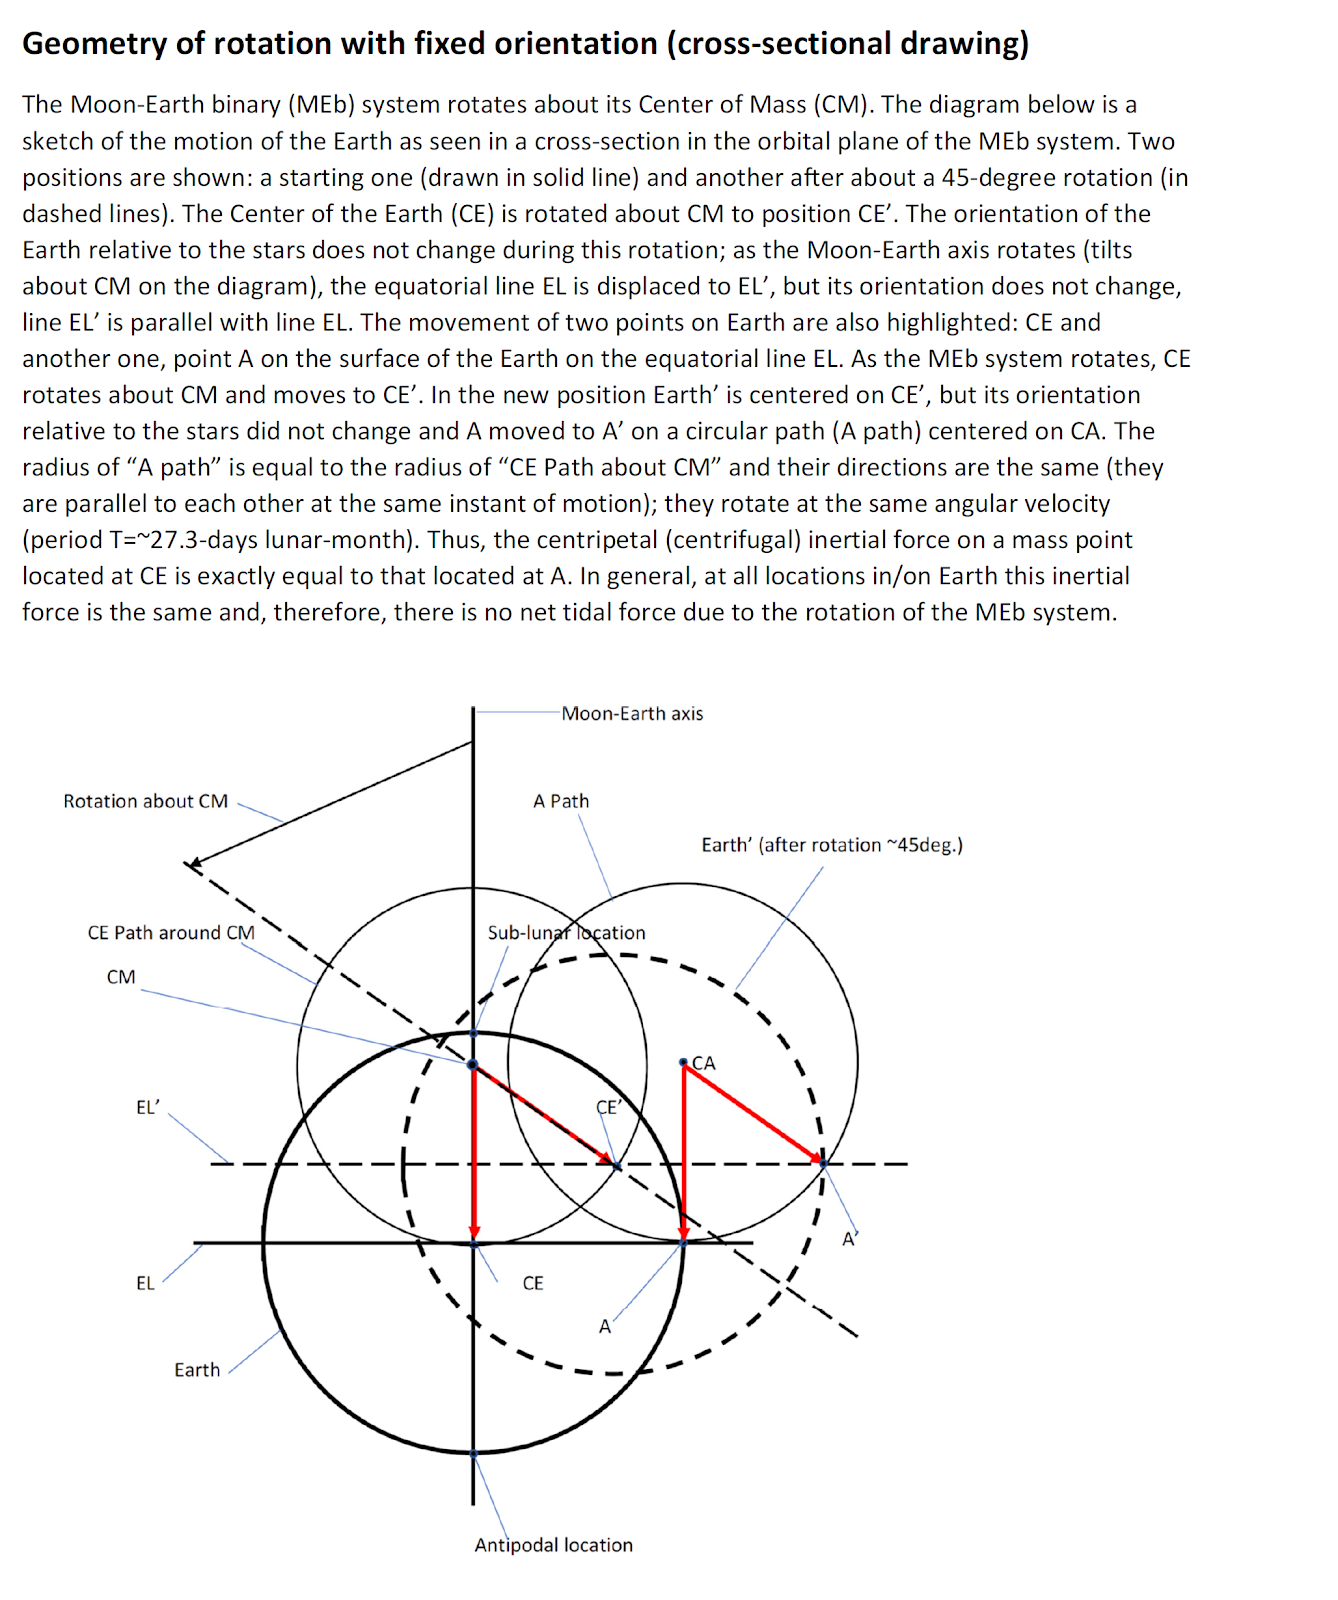
Figure 2